A Local LLM on Par with Opus 5? I Tried MiMo-V2.6 — the Big One Ran Too, With Multiple GPUs
Xiaomi, known for its smartphones, released the entire inside of its own AI in September. The numbers an AI acquires through training (called “weights") can be downloaded, so you can run it on your own computer too. Despite boasting a trillion parameters (the number that represents how big an AI is), it’s said to be free for anyone to use.
But what came out wasn’t one model — it was four. Which of them actually fits on a home computer?
This is a hands-on measurement as of September 2026.
- 1. What Is Xiaomi’s MiMo-V2.6?
- 2. Which Model Runs on a Local PC?
- 3. 9B Isn’t a “Small MiMo"
- 4. What I Measured
- 5. How I Measured It
- 6. Is 9B Faster Than a Model of the Same Size?
- 7. Where Do You Put the 117GB Flash to Get It Running Fast?
- 8. How Good Are 9B and Flash’s Answers?
- 9. What I Haven’t Confirmed in This Article
- 10. Summary — Of the Four Released, 9B and Flash Are What Ran Locally
- 11. How to Decide Whether to Try 9B and Flash
- 12. Gear Used in This Test
- 13. References
What Is Xiaomi’s MiMo-V2.6?
Xiaomi released four models under the name MiMo-V2.6 on September 21, 2026 (some Japan-time reports say the 22nd). This is based on what I confirmed on the Hugging Face distribution pages and model cards.
Hugging Face is a site where companies and individuals around the world publish and distribute AI models. Most of the AI you run locally gets downloaded from there. A model card is like an instruction sheet at the top of a model’s distribution page, where the creator writes down its size, benchmark scores, and license.
| Name | Position |
|---|---|
| MiMo-V2.6-Pro (distributed as Pro-RL) | The largest, flagship model. 1.02T (1 trillion) total parameters, with 42B active per token |
| MiMo-V2.6-Flash (distributed as Flash-RL) | The lighter one. 309B total parameters, with 15B active per token |
| MiMo-V2.6-Distill-Qwen-9B (called “9B" below) | The smallest. About 9.4 billion total parameters |
| MiMo-V2.6-Pro-UltraSpeed | Same content as Pro, but sped up from question to answer. Used through Xiaomi’s own online service (API); the weights aren’t downloadable |
Parameters are the number of values (weights) an AI adjusts through training — the more there are, the bigger the model. B stands for a billion, so 309B is 309 billion, 42B is 42 billion, and 15B is 15 billion. T stands for a trillion. A token is the small unit an AI uses to read and write text.
Of the four, only MiMo-V2.6-Distill-Qwen-9B isn’t a scaled-down version of Pro or Flash. It’s built on top of a completely different model called Qwen3.5-9B (more on this in a later section). Since the full name is long, I’ll call it “9B" from here on.
Pro and Flash are both MoE (Mixture of Experts) models — the whole model is large, but only part of it activates for each token it writes. Both support a context length (how much text you can feed in at once) of 1 million tokens, and the model card says they can handle images, video, and audio, not just text. Both are under the MIT license.
MIT means it can be used almost without restriction, including for commercial use. That lack of restriction is a big point in its favor.
What’s Its Selling Point?
The headline on the official model card is “Scaling Reinforcement Learning Toward Self-Improvement" — meaning they scaled up reinforcement learning (a way of learning where you try things and reinforce whatever worked) to build a model that keeps improving on its own. It says coding, agentic use (using tools to get work done), image handling, and cybersecurity were all trained together in a single round of reinforcement learning, rather than being handled as separate fields.
On Xiaomi’s official X account, Pro is presented as “matching Claude Opus 5 and GPT-5.6 Sol on most agentic benchmarks." The model card’s table also lists Flash’s numbers alongside it — for example, Terminal Bench 2.1 shows Flash at 87.6, Pro at 89.9, and Claude Opus 5 at 89.1; OSWorld-Verified shows Flash at 80.8, Pro at 82.0, and Claude Opus 5 at 83.4.
That said, these are all figures Xiaomi measured itself, including some benchmarks Xiaomi built in-house. They aren’t values a third party confirmed under the same conditions.
It’s Pro that’s being billed as “Opus 5-class," but the official distributed files add up to about 534GiB, and even the smallest community-made compressed version for home use comes to about 220GiB. That doesn’t fit even after adding 28GiB of external-GPU VRAM to my EVO-X2’s memory (128GB), so running it locally isn’t realistic. So this time, I tried seeing whether the lighter Flash would run instead. Flash is also running from a heavily compressed version, so I haven’t compared it against the official figures.
Which Model Runs on a Local PC?
The machine I have on hand is the GMKtec EVO-X2, a mini PC with 128GB of unified memory (about 122GiB as seen from the OS). For running local AI, that puts it on the larger side.
GMKtec EVO-X2 (Ryzen AI Max+ 395 / 128GB / 2TB)128GB unified memory mini PC
As an Amazon Associate we earn from qualifying purchases.
For the lighter Flash, I checked the sizes of the compressed (quantized) versions that are distributed. These are lined up from a list of files community members have published.
| Compression format | File size |
|---|---|
| MXFP4 | 155.9 GiB |
| Q3_K | 138 GiB |
| IQ3_XXS | 132 GiB |
| Q2_K (smallest) | 117.1 GiB |
The most heavily compressed version comes to 117.1GiB. Against the roughly 122GiB visible to the OS, there’s almost no margin. Q2_K is a fairly aggressive compression format, and it’s generally said to lower answer quality.
I actually tried running this Q2_K on the EVO-X2. With the default settings, it crashed partway through startup; after changing the settings and getting it running, the write speed came out to around 1-2 tokens per second, fluctuating from run to run. This EVO-X2 has two external graphics cards attached (an RTX 5060 Ti 16GB and an RTX 3060 12GB). When I offloaded part of the model to the memory on those cards (VRAM) and put the rest on the internal GPU, it ran stably at 13.00 tok/s (13 tokens per second). I’ll go into detail in a later section.
Pro (1.02T total parameters) doesn’t fit even in its smallest compressed version, at about 220GiB, so I didn’t test it on this machine. Pro-UltraSpeed’s weights aren’t distributed, so it can’t be run locally at all.
That leaves 9B. Its compressed version came to 5.43GiB. Going by size alone, that’s small enough to fit on a graphics card with 8GB of memory (I measured it on the mini PC’s internal GPU, not on an 8GB card).
| Version | Size (smallest compressed version) | On my EVO-X2 |
|---|---|---|
| Pro / Pro-UltraSpeed | Pro is 219.6 GiB (community compressed version); the official distributed files add up to 534.1 GiB. UltraSpeed isn’t distributed at all | Doesn’t fit into 128GB of memory plus 28GiB of external-GPU VRAM; not tested |
| Flash | 117.1 GiB | Fluctuates at 1-2 tok/s alone. Adding two external GPUs brings it to 13.00 tok/s |
| 9B | 5.43 GiB | Runs (write speed 37.7 tok/s) |
9B Isn’t a “Small MiMo"
Since the name is unified under MiMo-V2.6, it’s easy to assume this is just a scaled-down Pro or Flash. It isn’t. The distribution page states it’s built on top of an entirely different model, Qwen3.5-9B, with additional training on data MiMo created.
To put it as an analogy: this isn’t Pro’s little sibling — it’s more like a kid from a different family who studied under MiMo’s teaching method. The underlying structure stays Qwen’s, and what changed is what it was taught.
The distributor gives numbers for the gap against the base model. These are all self-reported by the distributor.
| Task | Base model as-is | After teaching | Difference |
|---|---|---|---|
| AutomationBench v1.0.6 | 5.0 | 30.3 | +25.3 |
| SWE-bench Pro | 32.0 | 44.6 | +12.6 |
| Terminal Bench 2.1 | 27.0 | 37.1 | +10.1 |
| Toolathlon-Verified | 25.9 | 35.2 | +9.3 |
| SWE-bench Verified | 60.0 | 61.1 | +1.1 |
The distributor’s table lists 11 tasks; I’ve included 5 of them here. Looking at the full table, every task involving using tools to carry out work (like AutomationBench above) shows a large gain. On the other hand, SWE-bench Verified (the bottom row), one of the older established coding benchmarks, barely moved. Going by this self-reported data, it didn’t get smarter across the board evenly — the gains vary by task.
What I Measured
I measured two things.
- I lined up 9B against the model it’s built on and measured read speed and write speed. I also had it solve 20 questions I prepared myself and looked at how correct the answers were and how the model’s confidence came out
- I ran Flash (117.1GiB) on the same EVO-X2 and measured whether it would start up and how write speed changed as I changed where the model sat (internal GPU, two external GPUs, CPU). Using the fastest placement I found, I also checked how smart its answers were on two kinds of questions
How I Measured It
9B Measurement Method
| Date measured | September 23, 2026 |
| Machine | GMKtec EVO-X2. Pinned to the internal GPU (Radeon 8060S) |
| Models measured | MiMo-V2.6-Distill-Qwen-9B (5.43GiB) / Qwen3.5-9B (5.29GiB, the base model) / qwen3:8b (4.87GB) / qwen3:14b (8.64GB) |
| Compression format | All aligned to Q4_K_M |
| Benchmark tool | llama-bench, which comes with llama.cpp (build b10941) |
| Path | Vulkan (a common backend that lets you ask any GPU vendor to run the compute) |
| Read speed | Speed when reading an input of 512 tokens |
| Write speed | Speed when writing 128 tokens. Launched separately from the read measurement |
| Runs | 5 runs each. Sort and drop the top and bottom, then take the median of the remaining 3 |
I chose the base model itself, Qwen3.5-9B, as the point of comparison. If two models are built from the same base, then any difference between them should come only from what was taught on top. I also lined up the previous generation’s Qwen3 8B and 14B as a reference point, since a lot of people are already using them.
The Qwen numbers I had on hand were measured a little earlier with a different build, so I re-measured everything with the same build this time. That’s because the build can shift numbers by a few percent (in fact, read speed differed by 4-7% between builds).
Flash Measurement Method
| Date measured | September 24-25, 2026 (Q3_K on September 26) |
| Machine | GMKtec EVO-X2 (internal GPU: Radeon 8060S) + external RTX 5060 Ti (16GB VRAM) and RTX 3060 (12GB VRAM) |
| Model | MiMo-V2.6-Flash-RL (the distributed file name), Q2_K, 117.1GiB (distributed by ggml-org) |
| Structure | 48 layers. Layer 0 is a normal layer; layers 1-47 are MoE layers |
| Tool | llama.cpp’s (build b10941) llama-completion. Uses all three GPUs at once via Vulkan |
| Content | Have it write 32 tokens continuing “The capital of Japan is" |
| Runs | 5 runs each. Sort and drop the top and bottom, then take the median of the middle 3 |
Both external GPUs are connected via PCIe straight into the machine, not through Thunderbolt. Here’s the article where I connected the RTX 5060 Ti via OCuLink (one type of connector for attaching an external GPU to a mini PC).
 https://kimono-oyaji.com/en/egpu-minipc-5060ti-2/
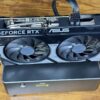
The two cards I added are the RTX 5060 Ti (16GB VRAM) and the RTX 3060 (12GB VRAM). For the RTX 5060 Ti, I’m using ASUS’s DUAL-RTX5060TI-O16G.
MoE (Mixture of Experts) is a design where a model contains many parts called “experts," and only some of them get used for each token it writes. Most of the file’s size comes from these expert parts.
I stumbled once at startup. Using the default settings with the GPU, llama.cpp tried to load the whole file into memory, and it got killed once system memory use climbed to 124,610MiB. Specifying mmap as the loading method fixed it. mmap (memory mapping) is a method that doesn’t load the whole file at once — it reads whatever part it needs from storage as it goes. Running on the CPU alone worked fine even with the default settings.
Where to Put Flash’s Experts — Three Conditions
In all three conditions, everything except the experts was placed on the internal GPU. Only the experts’ placement changed.
Not used
Not used
Everything except experts
All 47 layers of experts
Expert layers 1-5
Expert layers 6-9
Everything except experts
Remaining 38 layers of experts
Expert layers 1-5
Expert layers 6-9
Everything except experts + remaining 38 layers of experts
No experts placed here
S0 places all the experts on the CPU side and reads them via mmap. S1 moved the experts in layers 1-9 to the two external cards. S2 takes the 38 layers of experts that S1 left on the CPU and puts them on the internal GPU instead. Here’s how S2 was launched.
-dev Vulkan0,Vulkan1,Vulkan2 -ngl 99 -ts 0,0,1 \
-ot “blk\.([1-5])\.ffn_(up|gate|down)_exps=Vulkan1" \
-ot “blk\.([6-9])\.ffn_(up|gate|down)_exps=Vulkan0" \
-lm mmap –no-warmup –no-repack -t 32 -c 512 -n 32 –temp 0 -no-cnv \
-p “The capital of Japan is"
Vulkan0is the RTX 3060,Vulkan1is the RTX 5060 Ti, andVulkan2is the internal Radeon 8060S. The numbers change from machine to machine, so I pulled them from the names shown by--list-devices-ts 0,0,1weights the layer allocation toward the internal GPU.-ot(override-tensor) moves only the weights whose name matches to a different device, andffn_(up|gate|down)_expsis the naming pattern for the expert weights- S1 added
-ot "ffn_(up|gate|down)_exps=CPU"to this. S0 used-dev Vulkan2 -ngl 99 -cmoe -lm mmap(-cmoeplaces all experts on the CPU side)
Is 9B Faster Than a Model of the Same Size?
| Model | Size | Read speed [tok/s] | Write speed [tok/s] |
|---|---|---|---|
| MiMo-V2.6 9B | 5.43 GiB | 1,063.9 | 37.7 |
| Qwen3.5-9B (base, unmodified) | 5.29 GiB | 1,075.1 | 38.6 |
| qwen3:8b | 4.87 GB | 1,161.9 | 40.9 |
| qwen3:14b | 8.64 GB | 683.9 | 24.5 |
tok/s is the number of tokens processed per second; for Japanese text, that’s roughly 1-2 tokens per character.
| Compared against | Read speed | Write speed |
|---|---|---|
| Base Qwen3.5-9B as 100 | 99.0% | 97.8% |
| qwen3:8b as 100 | 91.6% | 92.2% |
| qwen3:14b as 100 | 155.6% | 154.0% |
There’s barely any difference between 9B and its base model. Read speed comes to 99.0% and write speed to 97.8% — close enough to call them the same, once you account for measurement noise. Compared with the previous generation’s 8B, it’s around 90% as fast; compared with 14B, it’s around 1.5x faster.
Put another way, the additional training didn’t change the speed. Since the underlying structure stayed the same as the base model, that’s the expected result.
Where Do You Put the 117GB Flash to Get It Running Fast?
First, the results from September 24, without using the external GPUs. I changed whether to use the GPU and how to load the file, and measured every combination that ran, 5 times each. The medians came to 0.83-2.01 tok/s, and per-run values ranged from 0.62-8.00 tok/s — more than 10x variance even within the same condition. My read on this is that the whole file can’t stay in system memory, so how much gets re-read from storage varies run to run depending on what happens to still be cached (I didn’t measure exactly what was left in memory each time).
The next day, the 25th, here are the results for the three conditions that also use the external GPUs.
| Condition | Write speed, 5 runs [tok/s] | Write speed median [tok/s] | Read speed median [tok/s] | Max system memory use [MiB] |
|---|---|---|---|---|
| S0 Internal GPU only (baseline) | 1.71 / 2.25 / 1.94 / 1.17 / 1.82 | 1.82 | 3.05 | ~16,800 |
| S1 9 layers on external GPUs, rest on CPU | 1.81 / 2.03 / 2.27 / 1.02 / 2.67 | 2.03 | 1.85 | ~16,000 |
| S2 9 layers on external GPUs, rest on internal GPU | 13.04 / 12.99 / 13.12 / 12.88 / 13.00 | 13.00 | 7.82 | ~108,700 |
System memory use is the machine’s overall memory use minus the portion set aside for the already-loaded file. All 15 runs correctly continued with “Tokyo," and none crashed from running out of memory.
S2’s write speed came to 13.00 tok/s, about 7 times the baseline S0’s 1.82 tok/s. Its 5 values landed within 12.88-13.12 tok/s, barely fluctuating. S0 and S1 fluctuated the same way they had the day before.
Does Moving to an External GPU Alone Make It Faster?
S1 is the condition where only 9 layers of experts moved to the two external cards. Its median came to 2.03 tok/s, and the gap from S0 falls within the spread of the 5 runs. If the external GPUs’ compute speed showed up directly, S1 should have clearly beaten S0 — but it didn’t.
The only difference between S1 and S2 is where the remaining 38 layers of experts sit. Moving that from the CPU side to the internal GPU is what pushed it up to 13.00 tok/s. That suggests the speed had been limited by running the experts’ computation on the CPU. That said, S2 changes two things at once: the compute device, and the fact that the experts are no longer being re-read from the file each time. These three conditions don’t let me separate how much each one contributed.
What Did the External GPU Actually Help With?
The memory the internal GPU uses is carved out of system memory — it isn’t a separate pool. Placing the remaining experts on the internal GPU requires about 95GiB free in system memory. The two external cards each have their own dedicated memory (VRAM). Offloading about 22GiB there is what let the rest fit into system memory (S2’s peak usage was about 108,700MiB).
If everything could be loaded onto the internal GPU without the external cards, they wouldn’t be needed at all. In the previous day’s measurement, the condition that tried loading everything onto the internal GPU with default settings got killed once it reached 124,610MiB. It looks like the external GPUs’ role here was providing somewhere to put things, rather than adding compute speed.
Does 13.00 tok/s Count as a Practical Speed?
On this blog, I previously set a rule of thumb: human reading speed comes to roughly 10 tokens per second, and anything above that can be considered fast enough for a real conversation. S2’s 13.00 tok/s clears that bar. At 1-2 tok/s, even a short 32-token reply took a while to finish; at S2’s speed, text comes out close to reading pace.
Here’s the article where I set that benchmark.

How Good Are 9B and Flash’s Answers?
I haven’t reproduced the benchmarks the distributor cites (like SWE-bench). Instead, I checked using questions I put together myself.
Does 9B’s Additional Training Show Up in Answer Quality?
I gave both 9B and its base model the same 20 questions: read a server log and pick the cause from 3 choices. For this, I didn’t have the AI state how confident it was — doing that almost always gets you “100%," which makes comparison meaningless. Instead, I read the internal probability behind the answer it chose.
| Model | Correct | Confidence range | Confidence average |
|---|---|---|---|
| MiMo-V2.6 9B | 18/20 | 49.6-90.2% | 71.6% |
| Qwen3.5-9B (base) | 17/20 | 45.3-71.9% | 54.7% |
The correct counts are 18 and 17 — a one-question difference. With 20 questions, one question is worth 5%, so this gap doesn’t say anything about which is better.
What stood out was how confidence was expressed. The base model tops out at 71.9% even on the question it’s most sure of. 9B goes as high as 90.2%. The averages differ clearly too, at 54.7% versus 71.6%. Both report lower confidence than their actual accuracy — subtracting stated confidence from the actual correct rate gives 18.4 points for 9B and 30.3 points for the base model. With only 20 questions, though, even a model whose stated confidence is accurate would normally show a gap around this size.
| Model | Questions missed | Confidence at the time |
|---|---|---|
| MiMo-V2.6 9B | 2 questions | 68.5% / 57.8% |
| Qwen3.5-9B (base) | 3 questions | 48.7% / 45.3% / 47.6% |
Neither model was ever confidently wrong. The highest confidence on a wrong answer was 68.5%. For the base model, there was a pattern where the lower its confidence, the more likely the answer was actually wrong. 9B only missed 2 questions, so there isn’t enough data here to say whether the same pattern holds for it.
In practice, reviewing the lowest-confidence answers first gets you to mistakes faster. That said, correct and incorrect answers overlap at the low-confidence end, so there’s no clean line where you can say “everything below this is safe." Across the 20 questions, the confidence values that came out were 19 distinct numbers, so reading the internal probability does spread the results out well.
How Smart Is Flash Running at 13 tok/s?
Using the same layer placement as S2, which ran at 13.00 tok/s, I stood it up as a server that answers questions sent from outside and measured it on two yardsticks. One is the same 43-question AEB benchmark I use for other models on this blog, with grading done automatically on a separate machine using a fixed procedure (not self-graded by the model). The other is the same 20 questions I gave to 9B. Both were run at temperature 0 (a setting that gives the same answer every time), once each.
| Item | Result | Note |
|---|---|---|
| Writing code (7 questions) | 6/7 fully correct | The remaining question also passed 90% of the hidden tests |
| Spec traps (6 questions) | 5/6 | On 1 question, the reasoning process collapsed into repeating “0," used up the full context length (8,192 tokens), and returned an empty answer |
| Questions with a false premise (18 questions) | Confabulation rate 0.267 (95% confidence interval 0.109-0.520) | Held back on 11, confabulated on 4, unjudgeable on 3. Lower is better |
| Following instructions exactly (12 questions) | 12/12 | |
| Same 20 questions as 9B | 11/20 (55%) | Confidence clustered at 35-47% across all 20 questions, and answers leaned toward “wait and see" |
Coding and instruction-following were nearly perfect. Two things caught my attention: one question where the reasoning process collapsed into a loop and produced no answer, and the 20-question set where the answers leaned toward a single option and confidence stayed similarly low across every question.
On the same 20 questions, 9B scored 18/20 and the base model scored 17/20. But Flash’s server invocation (how the chat format gets applied) differs from 9B’s and the base model’s, so I’m not ranking these three numbers against each other.
This time, I managed to get it running even with the version compressed down to 2 bits. But I did see a tendency for the reasoning process to break down partway through.
Does the Reasoning Still Break Down With the Less Aggressive Q3_K?
I also ran Q3_K (138GiB, distributed by community member AesSedai), which compresses less aggressively than Q2_K. Since it’s about 21GiB larger than Q2_K, I put the 4 layers that don’t fit on the two external GPUs plus the internal GPU onto the CPU, reading from storage as needed. An older llama.cpp build stalled right at the start of loading; the newer build available as of September 26 (build b11192) got it running.
Write speed came to 6.16 tok/s (the median of the middle 3 of 5 runs), about half of Q2_K’s 13.00. I checked its answer quality on the same questions as Q2_K.
| Item | Q2_K (117.1GiB) | Q3_K (138GiB) |
|---|---|---|
| Write speed [tok/s] | 13.00 | 6.16 |
| Writing code (7 questions), fully correct | 6/7 | 7/7 |
| Spec traps (6 questions), fully correct | 5/6 (1 question returned no answer) | 6/6 |
| Confabulation rate (lower is better, 95% CI) | 0.267 (0.109-0.520) | 0.250 (0.089-0.532) |
| Following instructions exactly (12 questions) | 12/12 | 12/12 |
| My own 20 questions | 11/20 | 13/20 |
The spec-trap question that collapsed under Q2_K got a correct answer under Q3_K. But that one question used 7,834 tokens of reasoning — about 97% of the available 8,192-token limit. About 200 more tokens, and it would have been cut off the same way Q2_K’s was.
The confidence intervals for the confabulation rate overlap heavily, so no difference can be claimed there. Q3_K also differs from Q2_K in llama.cpp build and layer placement, so I can’t isolate how much of any difference comes from the compression level alone.
I didn’t see the reasoning process break down under Q3_K. But there’s almost no headroom left in the context length, so questions that need long reasoning still risk getting cut off.
How Does It Compare to Other 128GB-Class Models?
Flash’s results alone don’t tell you whether this score is good or bad. So I lined it up against two models I’d previously tested that only run on 128GB-class machines: gpt-oss:120b (about 65GB) and nemotron-3-super:120b (about 86GB). Neither fits on a machine with 64GB of memory.
| Flash (Q2_K, 117.1GiB) | gpt-oss:120b (about 65GB) | nemotron-3-super:120b (about 86GB) | |
|---|---|---|---|
| Writing code (7 questions), fully correct | 6/7 | 6/7 | 6/7 |
| Spec traps (6 questions), fully correct | 5/6 (1 question returned no answer) | 6/6 | 6/6 |
| Confabulation rate (lower is better, 95% CI) | 0.267 (0.109-0.520) | 0.143 (0.040-0.399) | 0.118 (0.033-0.343) |
| Unjudgeable questions (out of 18) | 3 | 4 | 1 |
| Following instructions exactly (12 questions) | 12/12 | 12/12 | 12/12 |
| Code appearance quality metric (reference only) | 95.27 | 85.83 | 87.26 |
| Write (output) speed [tok/s] | 13.00 (2 external GPUs + internal GPU, llama.cpp) | 37.15 (internal GPU, Ollama) | 21.19 (internal GPU, Ollama) |
| Fits on the EVO-X2 alone? | No (ran only after adding external GPUs) | Yes | Yes |
This comparison has three differences built in. First, the compression format: Flash uses Q2_K, gpt-oss:120b uses MXFP4, and nemotron-3-super uses Q4_K_M. Second, the server invocation: Flash goes through llama-server, while the other two go through Ollama. Third, the measurement date: Flash was measured September 25, the other two on September 10-11. Write speed is the median of the middle 3 of 5 runs on the same 32-token prompt. The other two were measured via Ollama because llama.cpp couldn’t load them (measured September 26), so the tool differs from Flash’s as well. All three were run once each for the quality questions, so the run counts match there. Some of the differences in the numbers may come from these gaps; I haven’t isolated how much.
Code correctness matched across all three at 6 out of 7 questions. Flash came out highest on the confabulation rate, but the confidence intervals overlap heavily across all three, and the number of unjudgeable questions differs too, so no ranking can be drawn. The code appearance quality metric came out higher for Flash, but that measures how polished the writing looks, not correctness itself, and it’s based on a single run of 7 questions.
What this shows is that correctness and the confabulation rate are roughly on par with the other two 128GB-class models, with no clear ranking between them. The one clear difference was the single spec-trap question where the reasoning process broke down and produced no answer.
What actually separates them isn’t intelligence so much as how easy they are to run and how fast. gpt-oss:120b and nemotron-3-super both fit within the EVO-X2’s memory on their own, at write speeds of 37.15 and 21.19 tok/s. Flash didn’t fit on the EVO-X2 alone — it only reached 13.00 tok/s after adding two external GPUs. Because the tools and compression formats differ, I can’t claim a speed ranking from these numbers alone. Still, the two models that fit in one box are clearly more convenient. If you want comparable correctness, a model that fits on a single 128GB-class machine is the easier choice. The reason to pick Flash instead would be its multimodal design or the agentic use cases Xiaomi claims it’s strong at — neither of which I tested in this article.
What I Haven’t Confirmed in This Article
- I haven’t tested Pro or Pro-UltraSpeed. I haven’t verified Xiaomi’s claimed benchmark scores (including the Opus 5 comparison) myself, either
- I haven’t reproduced the distributor’s benchmark scores locally
- 9B’s test only has 20 questions. Since one question is worth 5%, the difference between 17 and 18 correct can’t be distinguished from chance. I also haven’t tested it on an 8GB graphics card
- Flash’s speed is based on a single 32-token generation on a single prompt. I haven’t measured its speed on long conversations or long pieces of writing
- I ran Flash as Q2_K and Q3_K. The difference between the two includes the compression level, but also differences in the llama.cpp build and layer placement. I haven’t compared against the uncompressed original. The quality questions were also run once each
- I didn’t test using just one external GPU, or changing the number and split of layers moved to the two external GPUs. I also didn’t look at differences in how the external GPUs are connected
- I haven’t separated how much of S2’s speedup came from “the compute device changing" versus “the experts no longer being re-read from the file each time"
- I haven’t tried this on other unified-memory machines besides the EVO-X2, or on different GPU combinations. I also haven’t looked at how it feels to actually use for real work
- The comparison with the other 128GB-class models differs in compression format, server invocation, and measurement date. I haven’t re-measured them all under matched conditions
Summary — Of the Four Released, 9B and Flash Are What Ran Locally
- Even at its most heavily compressed, Flash comes to 117.1GiB. On the 128GB EVO-X2 alone, it crashed with default settings, and even after specifying mmap to get it running, it fluctuated around 1-2 tok/s
- Offloading part of the experts to two external GPUs (RTX 5060 Ti 16GB, RTX 3060 12GB) and putting the rest on the internal GPU got it running stably at 13.00 tok/s. Just moving to the external GPUs while leaving the rest on the CPU barely changed anything
- Flash’s answers were nearly perfect on coding and instruction-following questions. But one question saw its reasoning break down without producing an answer, and it scored 11/20 on my 20 questions. On the less aggressively compressed Q3_K, that same question did get answered (write speed 6.16 tok/s)
- 9B is 5.43GiB, small enough to fit on an ordinary PC. But it’s not a small MiMo — it’s Qwen3.5-9B with additional training on MiMo’s training data
- 9B’s speed is nearly identical to its base model’s (99.0% on read, 97.8% on write). The 20-question score differed by just one question; what differed was how confidence came out
- I haven’t tested Pro or Pro-UltraSpeed
Flash, which looked like it “wouldn’t fit" going by memory size alone, reached a usable speed once I split up where it sat. Combining the machines I already have might still extend how large a model I can run locally.
For the article that measured at what size the internal and external GPUs swap places in a mini PC with added external GPUs, see here.

How to Decide Whether to Try 9B and Flash
| Your situation and use | What this result can tell you |
|---|---|
| You’re already using an 8B-class model and considering switching | 9B’s speed barely changes, so swapping it in won’t change how long you wait. The deciding factor is what’s inside, not speed |
| You’re torn between this and the base model, Qwen3.5-9B | Speed is the same, and my own 20 questions came out just one question apart. There’s no reason to choose based on speed |
| You want to have AI use tools and carry out multi-step tasks | This is the direction the distributor claims gains in. I haven’t confirmed that myself, though |
| You want to use it commercially | It’s MIT-licensed, so there’s almost no restriction. That can be a reason to choose it |
| You have a 128GB-class unified-memory machine with external GPUs attached | Flash is worth trying. Placing part of the experts on the external GPUs and the rest on the internal GPU got 13.00 tok/s |
| You only have a 128GB-class unified-memory machine, no external GPUs | Flash will run if you specify mmap, but it’ll fluctuate around 1-2 tok/s. That’s a speed you’ll be waiting on for conversation |
| Your memory is smaller than 128GB | Even Flash’s smallest version comes to 117.1GiB, out of reach. 9B is the candidate |
| Answer quality or speed on long conversations matters to you | Flash, compressed down to Q2_K, had one question where its reasoning broke down. I haven’t measured long-conversation speed either — that’s worth checking separately |
| You want to run Pro | I haven’t tested it, so this result can’t tell you anything |
The safe first step is to add 9B alongside whatever you’re already using, without removing it, and send the same questions to both. At 5.43GiB, it’s light on storage, and if it doesn’t suit you, removing it costs nothing. Reviewing the lowest-confidence answers first is a workable approach even at 9B’s scale.
If you have a 128GB-class machine with external GPUs and want to try Flash, start by checking the device numbers and names with --list-devices. From there, specify -lm mmap and move a few layers of experts to the external GPUs with -ot. Watching how much system memory gets used and gradually adding more experts to the internal GPU looks like the safer approach.
The figures in this article were measured as of September 2026 with the configuration above. Results will change as models and software versions change.
Gear Used in This Test
Mini PC: GMKtec EVO-X2 (Ryzen AI Max+ 395, 128GB memory)
GMKtec EVO-X2 (Ryzen AI Max+ 395 / 128GB / 2TB)128GB unified memory mini PC
External GPU: ASUS DUAL-RTX5060TI-O16G (RTX 5060 Ti, 16GB VRAM)
External GPU: RTX 3060 (12GB VRAM)
References
- MiMo-V2.6-Pro-RL (Hugging Face — Xiaomi’s official model card)
- MiMo-V2.6-Flash-RL (Hugging Face — Xiaomi’s official model card and benchmark table)
- MiMo-V2.6-Distill-Qwen-9B (Hugging Face — Xiaomi’s official model card)
- MiMo-V2.6-Flash-RL-GGUF (ggml-org’s distribution — the Q2_K version used here)
- MiMo-V2.6-Flash-RL-GGUF (community member AesSedai’s compressed version — the Q3_K version used here)
- MiMo-V2.6-Pro-RL-GGUF (community member AesSedai’s compressed version — used to confirm Pro’s size)
- Xiaomi MiMo’s official X post (comparing Pro and Opus 5)
- llama.cpp (GitHub)